Search

New Data Source from USDA Risk Management Agency Provides Early Read on US Crop Losses
Floods, droughts, derechos, and other environmental events pose risks to crop production across the US. Gro’s newly launched data source, the USDA’s Risk Management Agency (RMA) Cause of Loss report, gives detailed, district-level insight into where and why crops were damaged or lost as recorded by crop insurance adjusters.
RMA cause of loss data gives Gro users insight into:
- Indemnified crop acres due to specific environmental events that resulted in crop losses
- Total premiums paid for crops associated with specific environmental events
- Indemnities paid out to producers following events
- Government insurance liabilities associated with crop losses
This RMA data set updates weekly, providing Gro users a ground truthed look into crop conditions and losses that occur each month. The RMA data in Gro currently covers corn, soybeans, wheat, cotton, sugarcane, and sugar beets. More crops will be added in the future.
With this new data Gro users can incorporate climate events and data into actuarial analyses for major crops grown in the US.
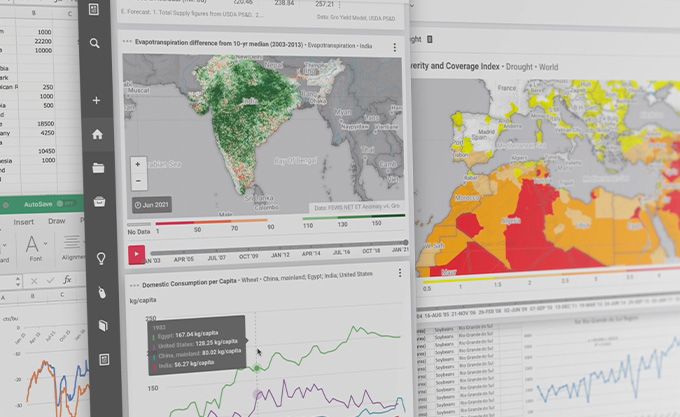
For example, on August 10th, 2020, a derecho storm system formed in southeastern South Dakota and swept east across central Iowa and northern Illinois. Iowa took the brunt of the damage; 80-120 MPH winds ripped across the state, damaging about 1.27 million acres of corn and 94,000 acres of soybeans. Benton, Marshall, and Tama counties were hit hardest, with losses recorded for a combined 358,000 corn acres. Indemnities paid out to soybean and corn producers following the event amounted to some $321 million. The fallout can be seen clearly in the choropleth map shown in this Gro Display.


Gro Displays provide a wider view of current markets and productions, while still allowing users to act on the small details. Displays offer a series of easy-to-use, aggregated Displays, including one that gives a comprehensive view of production.
RMA data is a key input for the US Cotton Production Monitor, our new Display that provides a one-stop, district- and state-level view into cotton production in the US. Access Gro’s US Cotton Production Monitor here.
Monitoring the US cotton markets in-season aids tracking regional supply chains and forecasting for the US cotton outlook. With over half of the US’ cotton crop production, Texas leads US cotton production.
Using our US Cotton Production Monitor’s Display as a tool, enables you to track the condition of cotton crop progress throughout the season and anticipate possible weather and climate-related supply disruptions. The Display includes insight into:
- Sourcing risks - By using Gro’s Drought Index (GDI) or our precipitation-related data, manage sourcing risks for areas that may suffer yield declines or abandonment due to overly dry or excessively wet conditions
- Allows for district-specific lenses - Look at cotton production acreage at district and state levels to gain a better understanding of crop-weighted risk
- Indemnified acreage - Pair historical yield with area planted and area indemnified information to arrive at a clearer prediction of expected production from specific districts ahead of harvest
- Weekly crop progress - Identify critical crop conditions during the growing season as weather conditions, including rainfall, unfold in various regions

Additionally, everything from hurricane and tornado damage to insect and aflatoxin pressure on crops can be assessed using RMA data.
A new Gro analysis shows that our indices, such as the Gro Drought Index, and rainfall and soil-moisture analytics can serve as leading indicators of RMA insurance claims; typically, RMA insurance claims are not recorded until they are confirmed by crop insurance adjusters.
RMA data can also be used with USDA planted-area data and yield data to anticipate production for crops that Gro does not currently produce yield models for, such as cotton or sugar beets.
RMA data is now available on the Gro Portal and API.
 Blog
BlogGain Actionable Insight Into Climate Impacts With The Gro Climate Ensemble
 Insight
Gro’s 2024 Watchlist: 3 Forces Shaping Global Climate Risk in the Year Ahead
 Insight
Improved Conditions Boost Prospects for India’s Upcoming Wheat Harvest
 Blog
Blog