Search

Custom Price Index Application: Track Inflation And Volatile Costs Down To The Inputs
Weather and climate impacts, trade restrictions, and supply chain disruptions are driving ingredient prices higher, negatively impacting manufacturers’ margins as well as consumers’ wallets.
We created the Gro Intelligence Custom Price Index Application to help companies from virtually all industries better manage their margins and their underlying costs, as well as compare product specific costs to competitor and industry averages.
To date, Gro has partnered with packaged food manufacturers, restaurants, grocers, food service providers, distributors, and energy companies, to help them better understand their cost of production today, historically and into the future on an ingredient by ingredient basis.
With a more granular view into a product’s ingredient costs, procurement, pricing, and hedging teams can make purchasing and product formulation decisions that factor in the most up-to-date, ingredient-level production cost data. Marketing teams can use our new application’s outputs to optimize product marketing strategies and strategy teams can use the application for competitive analysis.

The Gro Custom Price Index Application aids planning by providing a more granular view of costs. Unlike current in-house solutions that likely rely on product costs at a high level, this application leverages supply-side data to give a play-by-play picture of input costs.
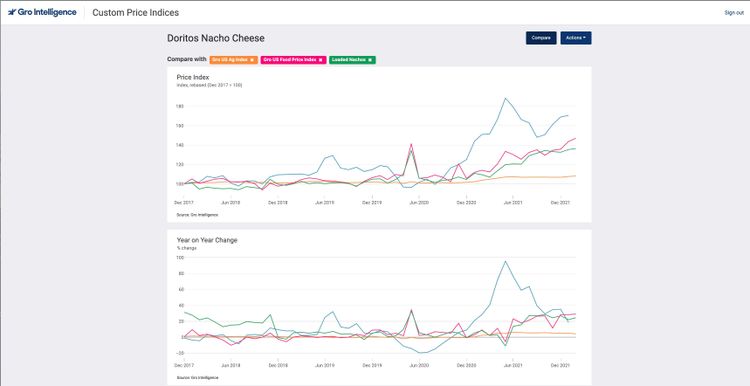
Gro users can also use this application to benchmark their products against the national averages of local cash price data, which is provided at a daily, weekly, or monthly frequency (depending on source); current monthly estimates are revised daily. Gro’s US Food Price Index is modeled off consumer spending on food such as grains, vegetable oils, fresh produce, proteins, etc… Gro’s China Ag Index and Gro’s US Ag Index, meanwhile, are modeled based on official government inflation indices. Used together, or separately, these indices enable greater insight into a product’s production benchmarking costs, while offering users a clearer view into how broader market activity is affecting their bottom line.
Our application computes pricing at user set input and weightings levels, so users can see price changes on an extended historical basis.
This application also provides:
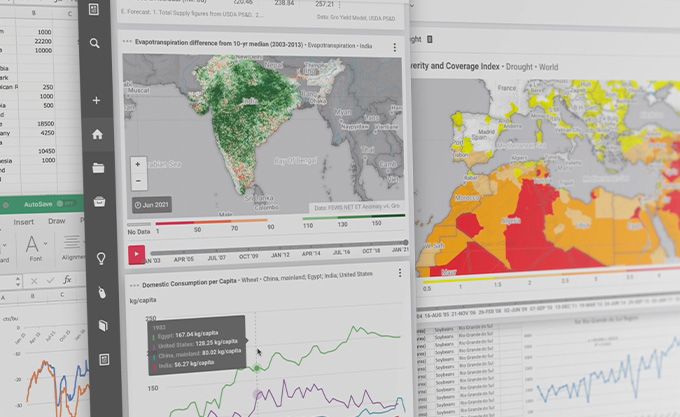
- Wider price series - Gro is the only platform that has 1 million different price series across the globe in our database, addressing a wide range of commodities and ingredients.
- Reimagined product formulation - By leveraging the in-app comparison price indices of Gro’s US Food Price Index, Gro China Ag Index, and/or Gro US Ag Index, users can compare prices and experiment with tweaking product inputs.
- Historical context - The application lets users see the breakdown of daily product production costs over the course of the year and over time.
This application can be used by food, energy, and finance companies alike:
- Packaged foods - For packaged food companies, this application facilitates ingredient cost monitoring and management at a product level. It can also be used to track inflation and production costs for ingredients individually and at a product segment level.
- Grocers and restaurants - For grocers and restaurants, the granularity that this application provides can inform ingredient purchasing and menu formulation plans; users can use our application to see how they can swap ingredients and alter menus before making purchasing decisions.
- Energy companies and financial firms - For energy companies and financial firms, this application provides insight into which inputs are driving inflation and impacting gross margins and potential earnings.
Gro’s Custom Price Index Application offers an unequaled set of proprietary data and modeling frameworks that can supplement a customer’s own retail and wholesale sales data (price and volumes) or the retail and wholesale price data that a customer is getting from other sources. Our platform has pricing information across multiple inputs, ingredients, and geographies, and our team of research analysts can work with you to create the most useful view of any product in your portfolio.
For more depth on our inflation coverage, please visit:
Get in touch with our sales team to schedule a demo today.