Search

To Track China Trade Deal, Watch Soybean Export Prices Using Gro Data
As the US and China prepare to sign a “phase one” deal to begin winding down their protracted trade battle, there’s lots of uncertainty over what it will mean for global agricultural trade flows.
Where China will source its soybeans, its biggest agricultural import, is of particular interest, and the deal has the potential to dramatically shift global soybean prices and trade. Gro Intelligence users can benefit from a host of data on the Gro platform to monitor China’s soybean purchases as they are announced, as well as to track prices and freight rates as a means of projecting future purchases.
A Doubling of China’s Agricultural Purchases
Under the “phase one” agreement, expected to be signed in Washington on Jan. 15, the US will reduce some tariffs on Chinese imports in exchange for a pledge from China to increase its purchases of US goods and services by at least $200 billion over the next two years. The Trump administration has specifically touted an increase in China’s purchases of US agricultural goods to between $40 billion and $50 billion per year, but Chinese government officials haven’t yet confirmed these figures. Very few details of the deal have been announced, and it’s still unclear if any tracking and enforcement mechanisms or penalties will be included.
The size and speed of such an increase in China’s imports of US goods has elicited much skepticism. An annual purchase of $50 billion in agricultural products would be twice the level seen in 2017 before the trade war began. Meanwhile, China’s need for soybeans as feed has declined as the country’s hog herd has been decimated by African swine fever. And competition to supply soybeans to China is high—Gro’s newly introduced Brazilian soybean yield model currently estimates that the country will produce a near-record 118 million tonnes of soybeans this year.
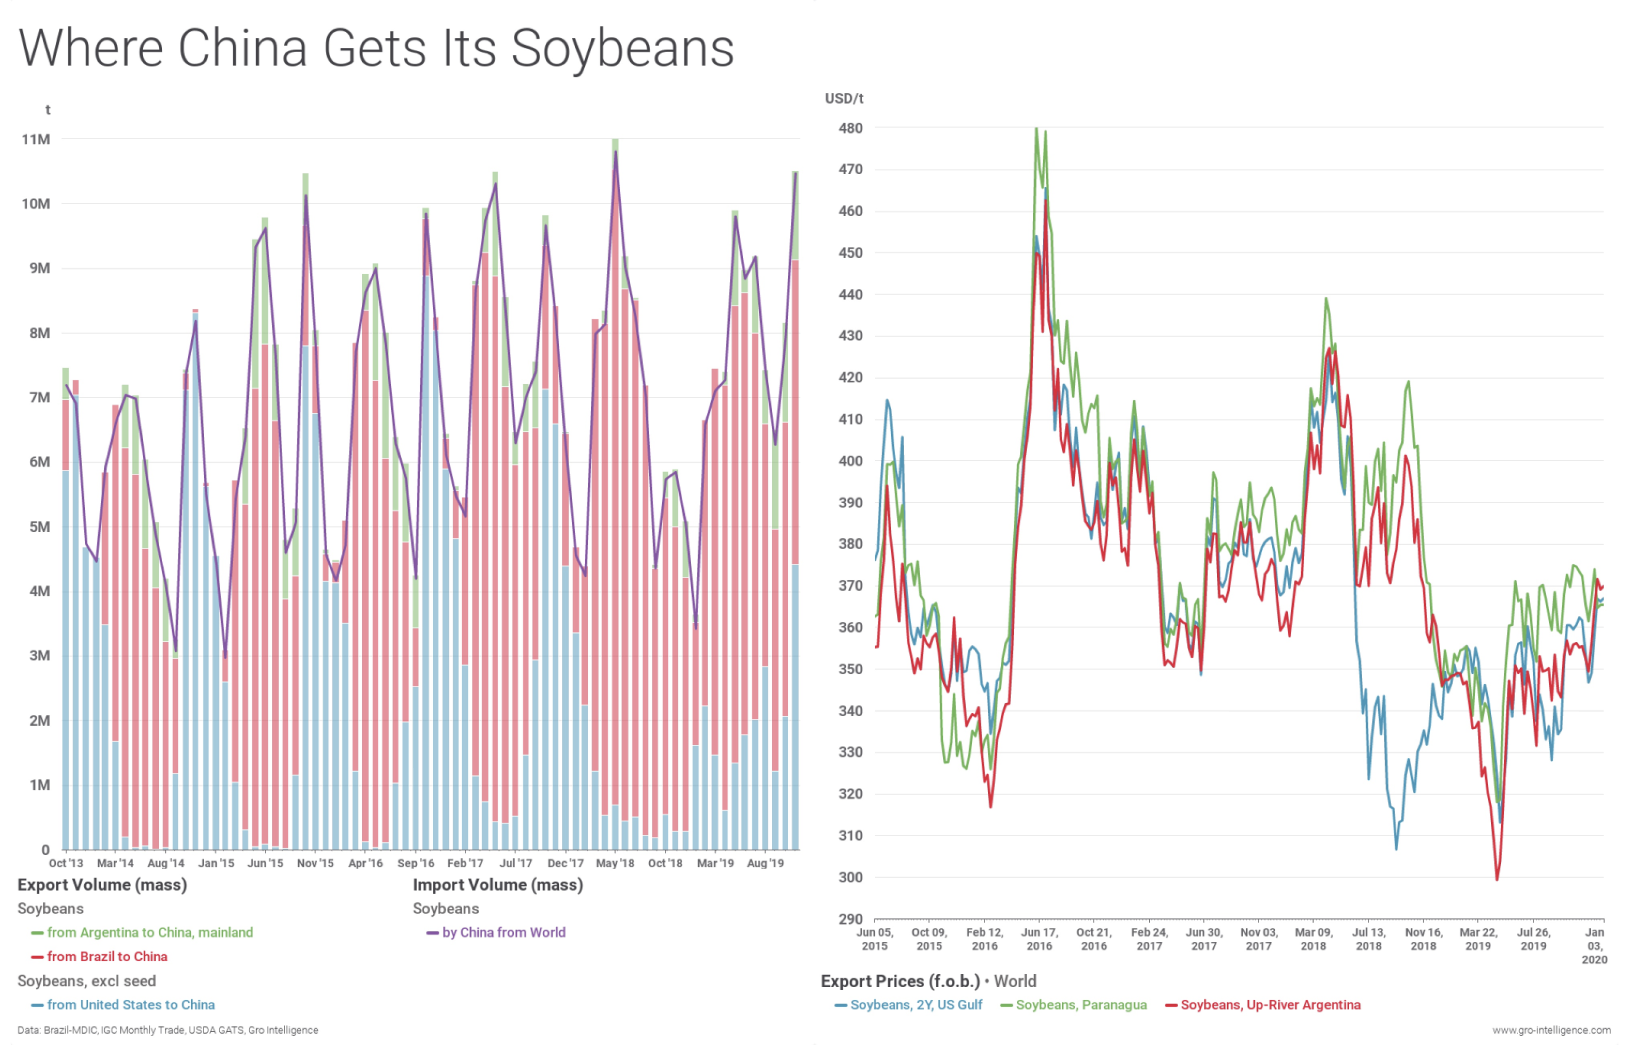
Soybeans are likely to account for the bulk of China’s expected $40 billion to $50 billion in agricultural product purchases from the US under the “phase one” trade deal. Export and price data on the Gro platform can be used to see whether those goals are being met and estimate future purchases. The stacked bars in the left chart show the monthly historical breakdown of China’s soybean imports by origin—the US (blue bars), Brazil (red), and Argentina (green), with total Chinese imports shown as a purple line. Price competitiveness among the origin countries is shown in the right chart, with the lines representing the US (blue), Brazil (green), and Argentina (red).
Various scenarios have been suggested for how China could meet the hefty purchase obligations. Chinese consultancy JCI China is notably confident in the country’s ability to meet the pledge. JCI estimates that roughly half of the total purchases would consist of 45 million tonnes of soybeans, which represents more than half of the 85 million tonnes of soybeans the USDA forecasts China will import in 2019/20. Beijing’s steering those purchases to the US would mean reducing South America’s share of sales to China.
JCI noted that its estimates assume that prices are favorable for China’s purchases. But with a large soybean crop projected for Brazil, it’s likely Brazil will be able to undercut US prices for much of 2020. Last year, Brazil and Argentina provided more than 80% of China’s imported soybeans, up from 60% before the US/China trade war began.
Paying a Premium for US Soybeans
Over the next year, we will discover whether Chinese soybean buyers will be willing to pay a premium for US soybeans in order to achieve the goals of the trade deal. Data from the International Grains Council (IGC), available on the Gro platform, allows users to compare soybean prices at major US, Brazilian, and Argentine ports. IGC freight rates are also available to assess the differential cost of shipping products from these origins to Chinese ports. Combined, the figures allow users to identify which countries present the most competitive offers to China.
Soybeans at the port of Paranagua in Brazil are currently offered at $367 per tonne. That’s $1.50 per tonne cheaper than offers at the United States Gulf. When the freight differential to ship soybeans to Dalian, China, is added to the comparison, Brazilian offers become more competitive by $7.50 per tonne.

Freight rate differentials are a key factor to consider when determining the landed price of goods at a destination. IGC data in this chart shows the cost per tonne of dry bulk goods shipped to Dalian, China, from the US Gulf (blue) and from Santos, Brazil (green). (IGC began reporting rates from Santos to Dalian in October 2019.) At current rates, it is $6/tonne cheaper to ship soybeans from Brazil. Freight rates can be combined with IGC origin port soybean prices to derive a landed cost of soybeans in China.
Gro’s platform also provides shipment and arrival data to enable users to track how much of China’s annual needs have been met. IGC data shows monthly trade for China, the US, Brazil, and Argentina. In addition, Brazil MDIC updates that country’s trade data monthly, and USDA GATS reports weekly shipments from the US.
With Brazil about to begin its annual soybean harvest, it should remain more competitive than the US in the near future. Brazil also has set its sights on dominance in global soybean markets and won’t want to abandon that goal. But if China drops its tariffs on US soybeans and works to rebuild its hog herd, Chinese purchases of US soybeans could rise sharply later this year.
It won’t be known until next year whether the aggressive “phase one” goal of $40 billion to $50 billion in Chinese purchases can be met through additional imports of US soybeans, grains, meat, and nuts. Reaching this target will require the alignment of a multitude of factors, many of which are available to monitor in Gro.

This insight was powered by the Gro platform, which enables better and faster decisions about factors affecting the entire global agricultural ecosystem. Gro organizes over 40,000 datasets from sources around the world into a unified ontology, which allows users to derive valuable insights such as this one. You can explore the data available on Gro with a free account, or please get in touch if you would like to learn more about a specific crop, region, or business issue.
 Insight
Prices Surge for Cocoa, Coffee, and Other ‘Soft’ Commodities
 Blog
BlogGain Actionable Insight Into Climate Impacts With The Gro Climate Ensemble
 Insight
Improved Conditions Boost Prospects for India’s Upcoming Wheat Harvest
 Blog
Blog