Search

Using Gro for Better Weather-Risk Management
How Climate Volatility Is Measured
Agriculture is one of the economic sectors most vulnerable to climate volatility. Businesses all along the agricultural supply chain need to prepare for additional economic risk when the weather becomes less predictable.
In the past decade, US climate volatility has increased substantially. In 2010, the NOAA Climate Extremes Index’s 10-year moving average for the whole US was 20.6%, just slightly above the 20% that is considered the index’s normal. By 2018, however, the 10-year moving average had jumped by more than half to 31.8%, as the index incorporated the three most extreme weather years on record—2012, 2016, and 2017. The only other time the 10-year average rose significantly above normal was in the 1920s, when it reached 23.1%.

The chart above shows NOAA’s Climate Extremes Index, produced annually for the contiguous US. The red line is the 10-year rolling average, and the horizontal dotted line is the norm, or the average value for the full history. The past 10 years has seen the largest rise in the 10-year average in more than a century.
Climate volatility measures quantify the frequency and intensity of extreme weather conditions relative to normal. Quantifying weather volatility provides a useful input for any analysis where weather plays a role. For that purpose, NOAA developed the US Climate Extremes Index (CEI), whose data goes back more than a century, with the goal of distilling a complex set of climatic data into a single indicator.
CEI is constructed using temperature, precipitation, and the Palmer Drought Severity Index (PDSI), which is an estimate of relative dryness using historical temperature and precipitation data. CEI uses the following five indicators: 1) the percentage of the US with maximum temperatures much above or much below normal, 2) the percentage of the US with minimum temperatures much above or much below normal, 3) the percentage of the US in severe drought or severe moisture surplus, 4) the percentage of the US with a much greater than normal proportion of precipitation derived from extreme single-day precipitation events, and 5) the percentage of the US with a high concentration of days with precipitation or a high concentration of days without precipitation.
“Much above” and “much below” normal thresholds are defined as values falling in the upper and lower tenth percentile of the local period of record. The CEI is also structured so that the expected value of each indicator, and the overall CEI, is 20% in any given year. Further methodological details can be found on the NOAA website here.
The Climate Extremes Index is also calculated for each US Climate Region and shows that climate volatility has varied widely by area of the country. For example, in the West, which includes California, the latest 10-year average CEI is 36.4%; for the Upper Midwest it’s 35.1%, 32.6% for the Ohio Valley, and 31.8% for the Southeast. In contrast, the Northern Plains’ 10-year average CEI is just 27.2%.
The CEI’s Climate Regions aren’t categorized based on agriculture. Gro users, wanting to focus on specific agricultural areas, can perform these calculations for any custom region, including those targeted to specific crops and those outside the US, by using the methodology described lower in this article.

The chart above shows the Climate Extremes Index’s 10-year moving averages for a select group of US Climate Regions. Climate volatility has been rising for key agricultural producing regions.
What Climate Extremes Mean for Agriculture
The most obvious way climate volatility impacts agriculture is through higher variation in yields. A greater frequency of heat stress events has been shown to severely reduce crop yields. Water availability may become less certain, which can also cut yields or lead to increased outlays for irrigation. A study sponsored by the European Commission that simulated 29 crop/country pairs concluded that production and prices of corn, soybeans, and wheat were highly sensitive to agroclimatic extremes. The study noted that weather volatility in a single region could have significant economic impacts even at the global level.
On the other hand, reduced frost frequency in typically cold regions, or greater precipitation in dry regions, can increase yields, which can in turn depress prices. Storage operators may not have enough room to accommodate the oversupply and on-field crop abandonment may increase.
Heightened weather uncertainty can confound conventional farm economics, throwing off farmers’ planting decisions. Revenues dependent on crops at higher risk for flood or drought need to be protected by additional insurance. Even extreme weather in other regions can cause the prices of key planting inputs, such as energy and fertilizer, to unexpectedly soar.
Perennial crops, such as grapes, almonds, and avocados, represent a different challenge when it comes to climate volatility. An analysis of perennial crops in California, which has been ravaged by drought in recent years, predicted that such climate uncertainty can be expected to reduce yields by up to 40% by 2050. Significant infrastructure investment would be needed to expand perennial crops into cooler regions. In addition, up to 30 years of lead time is necessary for proper cultivation of orchards and vineyards.
NOAA’s Climate Extremes Index is currently available through 2018. Major weather events have continued in 2019, including widespread spring flooding in the US Midwest and an early blizzard last weekend in the Northern Plains, which caused frost damage and delayed harvest for late-maturing corn and soybeans in North Dakota. Late planting and wet weather have also raised concerns about the quality of the spring wheat crop in the US and Canada, two of the biggest exporters of high-protein wheat.
Elsewhere, a major heat wave impacted corn and sugar beet yields in Europe this summer; two devastating cyclones hit Mozambique, wiping out millions of acres of cropland; winter wheat output in Australia was reduced by persistent drought; and intense Indian monsoon rains late in the season caused much of the country to shift rapidly from drought to floods, causing changes in yield expectations for a variety of crops.
Many of these climate events, and their impact on agriculture, have been previously covered by Gro Intelligence Insights. Please see the links at the bottom of this article for more detailed discussions.
Gro Analysis of Volatility and Crop Yields
A Gro analysis of 14 major US crops showed a higher probability of extreme yields in abnormally volatile climate years. Our study found that there was an equal likelihood of yields surprising to the upside or downside in volatile weather years. However, the downside surprises were of greater magnitude for most of the crops, leading to a negative average detrended yield in most cases.
Since 1950, there were seven years where the NOAA CEI was 30% or higher: 1998, 2006, 2012, 2015, 2016, 2017, and 2018. In those seven years, yields were more than twice as likely to be extreme, defined as at least one-and-a-half standard deviations above or below trend. Detrended national yields and the CEI were positively correlated over a 30-year window for 13 of the 14 crops. As a result, our analysis concluded that climate extremes had a notable impact on the volatility of agricultural yields.
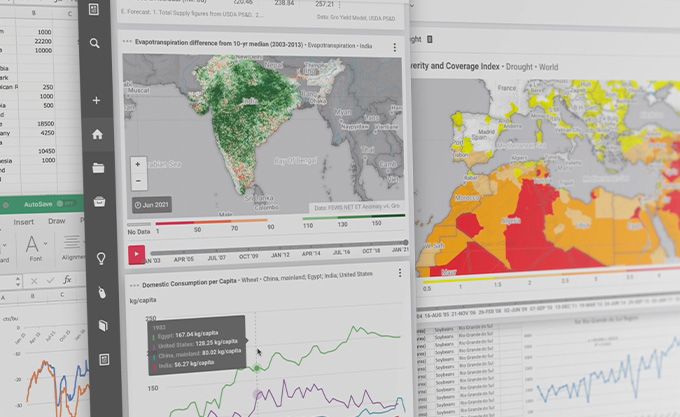
Using Gro Data to Construct a Volatility Index
Gro users can construct their own version of the Climate Extremes Index using the data in Gro and the methodology that NOAA adopted for its index, described here. An index can be constructed for almost any region, not just the United States, and at a monthly frequency. For example, in the charts below, we calculate a monthly index for Argentina and Yunnan province, one of the largest crop-growing regions in China.
To build these examples, we use Gro’s database of observed temperature and precipitation series dating back to the 19th century. These data are averaged by district to create a single continuous time series that spans more than a century. If necessary, temperature and precipitation data can be supplemented by remotely sensed sources, such as satellites, beginning in 2000.
We also use a Gro-derived drought index based on remotely sensed evapotranspiration data, which is the combined quantity of water removed via transpiration from plants and via direct evaporation from soil, water, and vegetation surfaces.
Gro users can also add forward-looking climate indicators to their models. NOAA’s Global Forecasting System (GFS) contains temperature and precipitation forecasts up to 15 days in advance. GFS could be used to monitor short-term weather risks and predict future drought index readings during periods when crops are most susceptible to weather risk.
For longer-range forecasts, the Multivariate ENSO Index, a newly added source in Gro measuring El Nino and La Nina conditions, may be shown to predict future climate volatility in some regions.
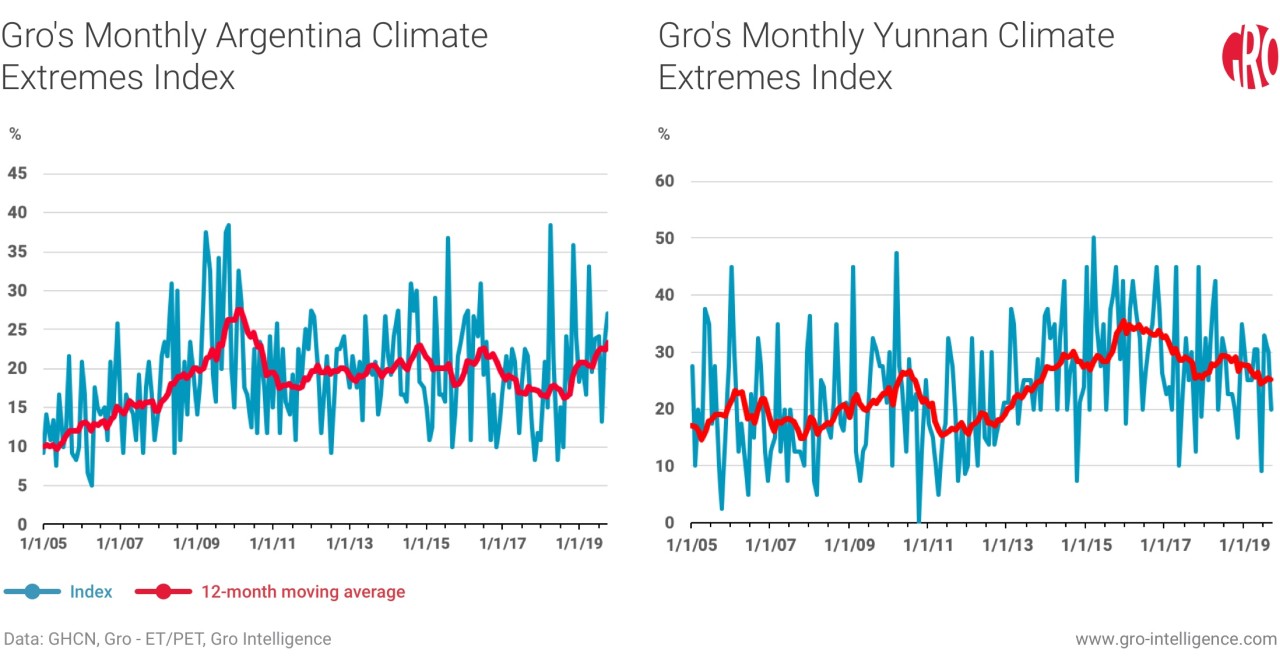
The above charts show climate volatility indexes for Argentina (left) and Yunnan province in China (right), calculated using data in Gro. In Argentina, climate volatility has been close to the normal value of 20% for the last decade. Extreme climate conditions have been more prevalent in Yunnan, where the 12-month moving average has remained well above normal in recent years.
Conclusion
Understanding climate volatility patterns and at-risk regions can help assess vulnerabilities in advance and mitigate risks associated with adverse weather. Studies have shown that many businesses have not suitably acknowledged the risk that potential climate change poses. Therefore, simply recognizing and contextualizing climate volatility should be a step in the right direction for better weather-risk management.
By quantifying extreme climate events, and applying the methodology to all areas of the globe, policy makers can better decide where to invest in infrastructure improvements. Financial institutions can get a better handle on weather risks and improve pricing of insurance products. Planting decisions can be improved by a more concrete assessment of such consequential, albeit infrequent, events.
Related Insights from Gro Intelligence:
Where Midwest Floods Have the Most Impact on Acres Planted
Hard Wheat Worries: Will North America's Crop Make the Grade?
Monsoon Turnabout Shifts India’s Crop Outlook
Frost Will Nip Some of US Crop, but Most Areas Will Be Spared
Addition of GFS Highlights Gro’s Analysis Ready Data for Machine Learning Models
US Cotton, Peanuts, Soybeans at Risk as Hurricane Dorian Moves North
California Drought Is Over, but Data Highlights State’s Challenges Ahead
 Insight
Prices Surge for Cocoa, Coffee, and Other ‘Soft’ Commodities
 Blog
BlogGain Actionable Insight Into Climate Impacts With The Gro Climate Ensemble
 Insight
Gro’s 2024 Watchlist: 3 Forces Shaping Global Climate Risk in the Year Ahead
 Insight