Search

China Wheat Yield Forecast Model
Gro’s Yield Forecast Models use a suite of machine-learning models to estimate in-season yields at the district, province, and/or national levels on a daily basis. Gro's China Wheat Yield Forecast Model employs two separate models to track one public and one private data source for forecasts of province-level wheat yield.
Customers Use the Model to
- Monitor crop production, the most significant part of the balance sheet, by tracking its most variable component, which is in-season
- Make data-driven business decisions on issues that are dependent on Chinese wheat production
- Monitor crop production, the most significant part of the balance sheet, by tracking its most variable component, which is in-season yield
- Gauge crop availability and crop prices
- Understand how weather impacts yields in microclimates
- Inform other models focused on damage caused by pests and diseases
Why It Matters
China is a major player in crop production and consumption patterns, driving global trends and trade dynamics. The country is the world’s largest wheat producer, with production of approximately 130 million tonnes per year, or one-fifth of the global total. While China uses nearly all its wheat output domestically, variations in its huge production can have big implications for global wheat balance sheets. As most of China’s crop is winter wheat, conditions during the months of March and April are a significant harbinger of the size of the harvest at the start of summer.
Methodology
These machine-learning models are driven by inputs reflecting long-term trends as well as in-season changes. The models run daily throughout the growing season, and rely on province-by-province signals derived using our domain expertise. Proprietary land cover data, built using high resolution satellite imagery, is an essential component to improve the predictive power of the model. Major model inputs and features include:
- Normalized difference vegetation index (NDVI) signals of wheat fields, based on Gro’s specific land cover maps. Satellite-derived NDVI is a powerful indicator of plant health that uses infrared light waves to detect positive signals and plant stressors.
- Temperature from Global Historical Climatology Network (GHCN)
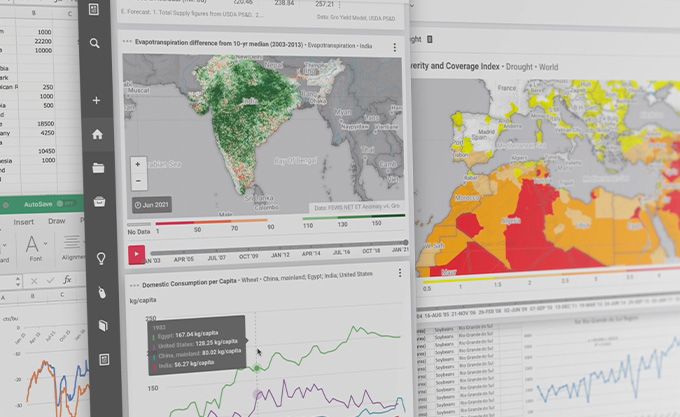
- Evapotranspiration
- Temperature
- Soil characteristics
- Longitude and latitude
Related Resources
Display: China Wheat Yield Forecast Model
Gro's India Wheat Yield Forecast Model
China’s Protein Demand Pushes Corn to New Highs, Lifts Wheat Consumption
 Insight
2023 Performance Report: Gro Yield Forecast and Acreage Models
 Blog
BlogGro’s 2023 Performance Report Shows Accurate Prediction Months in Advance of Final Reporting
 Blog
BlogAnticipate Climate Impact on Agricultural Supply with Gro Supply Risk Levels
 Blog
Blog