Search

Why Historical Data Matters In Unprecedented Times
Extreme climate and weather events such as droughts, heat waves, and heavy rainfall are becoming more intense and more frequent every year, disrupting the global agricultural supply chain.
According to the IPCC’s Sixth Assessment Report, “even relatively small incremental increases in global warming (+0.5°C) cause statistically significant changes in extremes on the global scale…In particular, this is the case for temperature extremes (very likely), the intensification of heavy precipitation (high confidence), and the worsening of droughts in some regions (high confidence).”
Navigating these events will require businesses to leverage data to adapt risk management strategies, procurement practices, and supply chain infrastructure.
The role of historical data in agricultural, climate, and economic analysis
Historical data is a crucial input to agricultural, climate, and economic analysis, and serves as the foundation for understanding impact when businesses face disruption to “normal” operating conditions. This information can help businesses decide how and when to secure supply, hedge opportunities, adjust order volume, or increase insurance coverage.
For example, when droughts hit certain crop-producing regions, agribusinesses or traders can use historical data to compare conditions to previous years, and identify what key determinators (e.g. precipitation and land surface temperature) warrant more attention in the following months to understand whether the crop yield could recover by harvest time.
How technology is making complex historical data more accessible
Accessing and interpreting historical data has always been a challenge for businesses. Agricultural, climate, and economic data is typically siloed, produced without context or intuitive query tools. Combining these disparate data sets to form a comprehensive narrative is often a manual and expensive proposition that requires several third-party services — a challenge for even the most dedicated and well-funded research experts.
Real-world research and reporting requires a multi-layered approach to historical data. For instance, the rise in intensity and frequency of extreme weather events is coinciding with rapidly developing infrastructure and increasingly vulnerable legacy infrastructure in exposed areas. By 2050, an estimated 800 million people will live in more than 570 coastal cities that are vulnerable to a 0.5 meter rise in sea level.2 This type of interconnected statistic requires an understanding of complex sets of historical socio-economic, climate, topographical and anthropogenic data.
AI and machine learning (ML) models have now made it possible to ingest enormous sets of historical data, enabling researchers to visualize conditions on the ground throughout time. These ML models can find connections between inputs and outputs that were previously too complex or widespread for human researchers alone. They can shed light on the circumstances leading up to and following extreme events, or where subtle shifts to a “new normal” are occurring due to climate change.
How Gro Intelligence uses decades of historical data
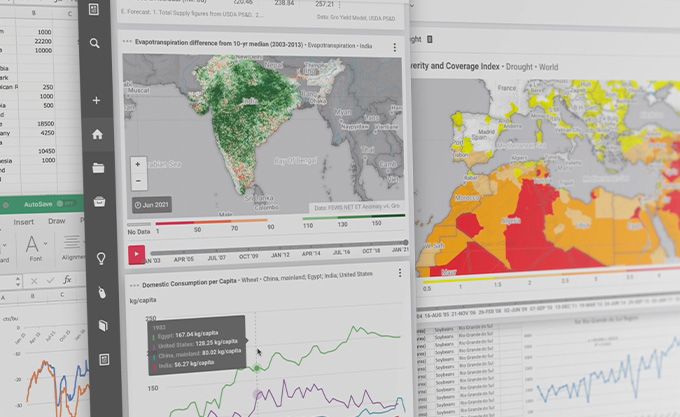
Gro has built the world’s largest agriculture and climate data platform that ingests over 180,000 data sets from hundreds of sources, with history spanning decades, and in some instances, even centuries. The data contributes directly to Gro’s ability to provide highly accurate forecasts in global commodities markets, and insights into climate and economic impacts.
For example, to find out how hurricanes are becoming more damaging and costly to the US, Gro’s ingests input data such as historical hurricane trajectories, maximum wind speeds, human population statistics, infrastructure locations and values, and more. Furthermore, projections for risk levels into the future require thousands of simulations to determine the areas at risk of damage given potential changes in climate and weather patterns and population trends.
Gro’s models can generate a single risk score down to a specific state, district or crop growing region.
Gro blends its historical data into its powerful predictive models which are curated, trained, and tested by a group of 50+ domain experts and data scientists. These models have been trained for over 7 years, allowing Gro to deliver accurate predictions to our commercial partners months ahead of government reporting.
To learn more about Gro models, click here to view Gro’s 2022 Performance Report.
Sources:
- Rodell, M., Li B., Changing intensity of hydroclimatic extreme events revealed by GRACE and GRACE-FO, The Journal Nature Water. 2023
- MacManus, K., Balk, D., Engin, H., McGranahan, G. and Inman, R. 2021. Estimating population and urban areas at risk of coastal hazards, 1990–2015: How data choices matter. Earth System Science Data
- WEF 2019. The Global Risks Report 2019, 14th Edition. World Economic Forum
 Insight
Prices Surge for Cocoa, Coffee, and Other ‘Soft’ Commodities
 Blog
BlogGain Actionable Insight Into Climate Impacts With The Gro Climate Ensemble
 Insight
Gro’s 2024 Watchlist: 3 Forces Shaping Global Climate Risk in the Year Ahead
 Insight