Search

Ukraine Winter Wheat Yield Forecast Model
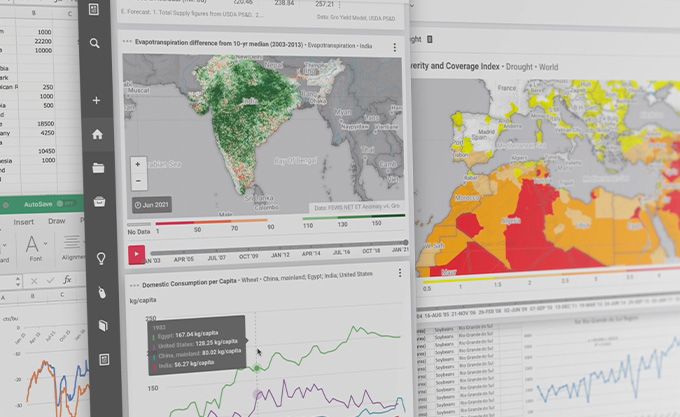
Gro’s Yield Forecast Models use a suite of machine-learning models to estimate in-season yields at the district, province, and/or national levels on a daily basis. Gro’s Ukraine Wheat Yield Forecast Model tracks wheat production across all provinces. The model looks at factors influencing wheat yield in the country, including potential evapotranspiration and precipitation. Given the global significance of the Black Sea region, Gro has also developed a Black Sea Yield Forecast model that combines output from Russia and Ukraine.
Customers Use the Model to
- Gauge crop availability and crop prices
- Predict future trends such as crop yields and production, agricultural input demand, and significant weather patterns
- Gauge crop availability and crop prices
- Understand how weather impacts yields in microclimates
- Inform other models focused on damage caused by pests and diseases, as well as for price forecasting
- Monitor crop production, the most significant part of the balance sheet, by tracking its most variable component, which is in-season yield
- Keep track of wheat production in all provinces of Ukraine
Why It Matters
Wheat is one of the most actively traded crops on the global market, and the Black Sea has increasing significance to this trade. The region is the largest and lowest-cost exporter of wheat to the world. Wheat from Russian and Ukraine forms the majority of the region’s imports and exports. Much of the exported crop is shipped through the Black Sea to North Africa, the region with the greatest wheat demand.
Production in the region has a major influence on global prices and export demand from other major origins. Further, Black Sea futures and options contracts introduced in 2018 have been received positively and traded actively. As such, forecasting yield in the region is important for anyone involved in producing, trading, or using wheat around the world.
Methodology
The Ukraine and Russia Winter Wheat Yield Forecast Models were trained on province-level yield data from UKRSTAT and EMIS datasets. Unlike the US, where there is extensive documentation of what crops are planted on which plots of land, many other world regions lack detailed data on where different crops are grown. This information is needed to construct a crop distribution map, or land cover, in order for satellite data to estimate the crop’s health and size.
Therefore, to obtain acreage data of where wheat is grown in Ukraine, we used the timing of its planting and growth. Given that knowledge, we used dated satellite data to identify the location where each crop is planted. In particular, for this model, we used a combination of satellite image types. Satellite-derived radar data, which removed significant variation produced by cloud obstruction, was added for these models and used in conjunction with Landsat image data to construct the land covers.
Still, satellite-data-generated land covers are inherently less accurate than ground-truth land covers, such as those in the US. As such, we also incorporated evapotranspiration and GHCN weather station precipitation data into the model.


Related Resources
Gro's Black Sea and US Wheat Yield Forecast Models: An Inside Look
 Insight
2023 Performance Report: Gro Yield Forecast and Acreage Models
 Blog
BlogGro’s 2023 Performance Report Shows Accurate Prediction Months in Advance of Final Reporting
 Blog
BlogAnticipate Climate Impact on Agricultural Supply with Gro Supply Risk Levels
 Blog
Blog